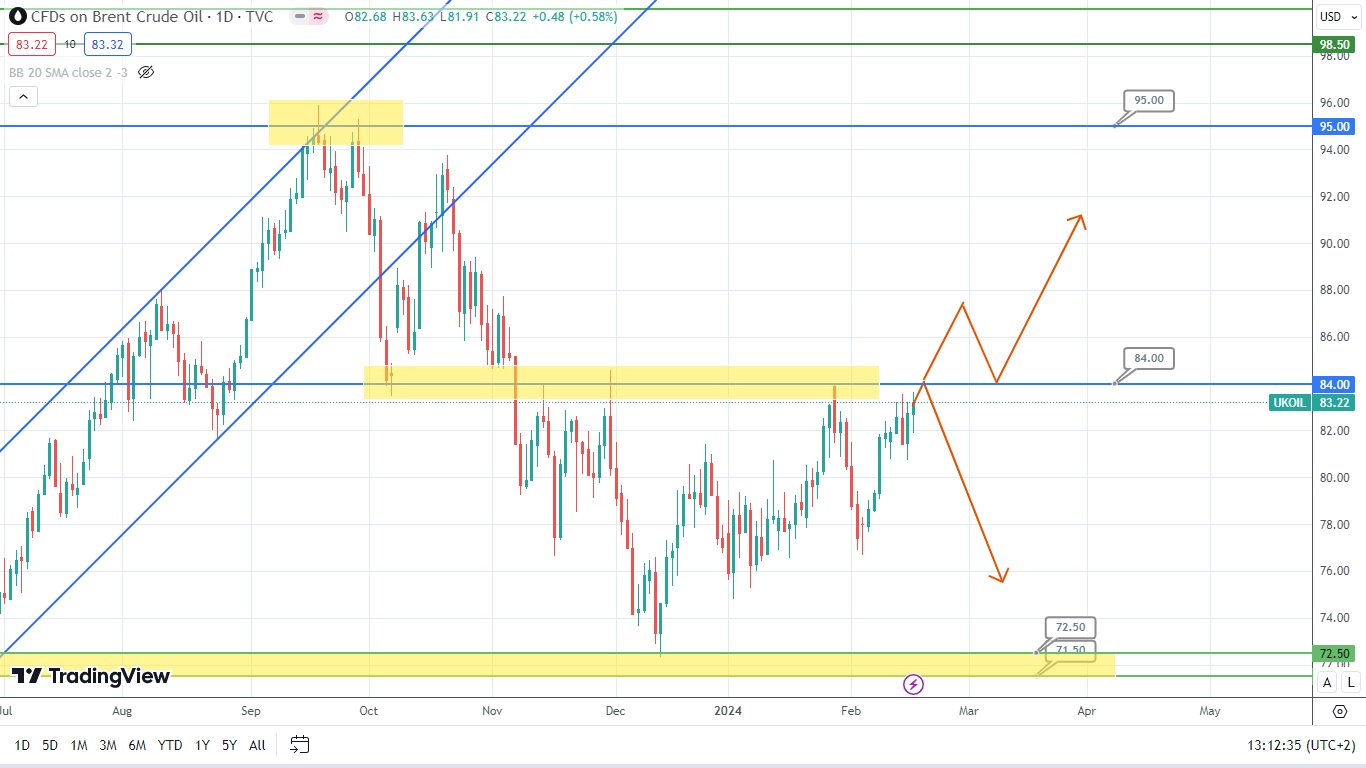
Brent Oil at Crossroads: Potential Rebound or Price Rise Ahead?

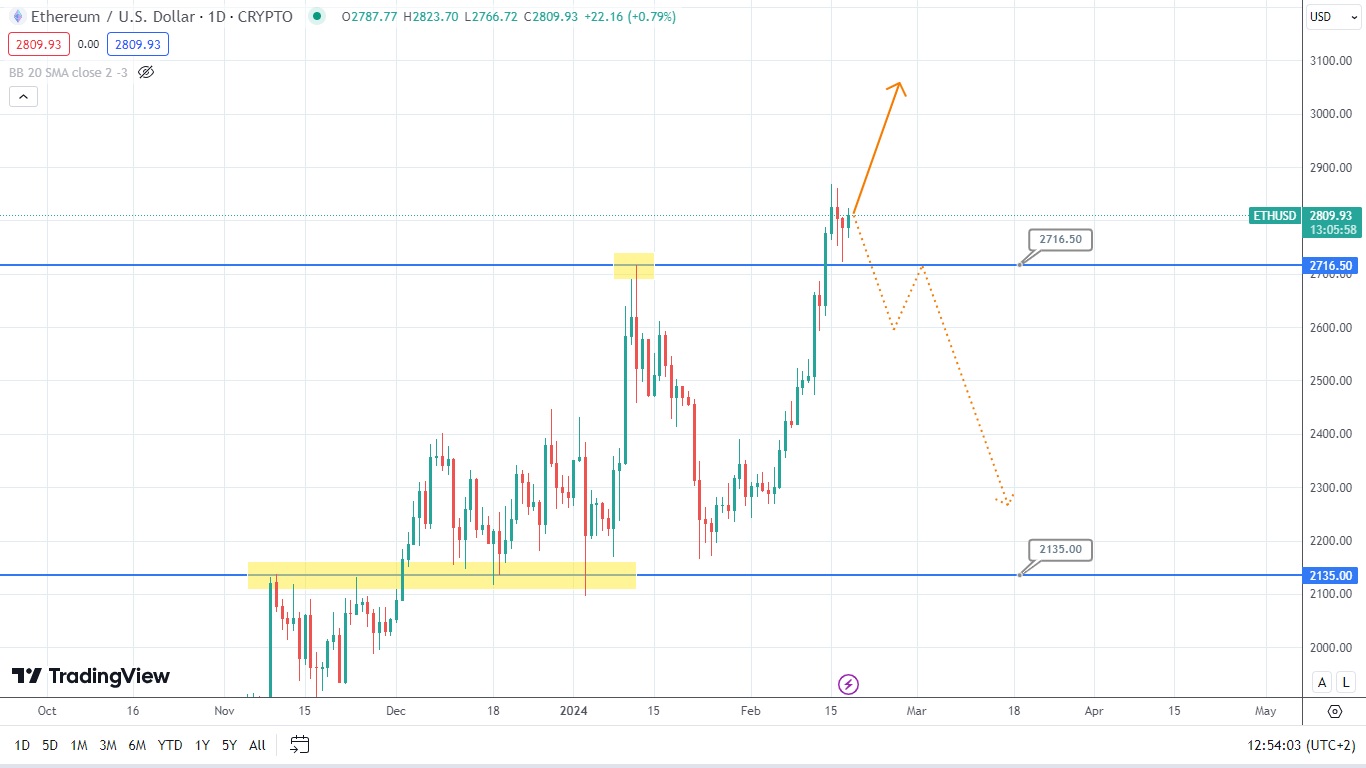
Ethereum is following Bitcoin. Currently, the price of this asset is heading up. It broke a very important resistance level of 2716.50. The asset’s price might potentially hit the level of 3000. Of course, it might also drop, dive under the broken resistance, undergo correction, and approach the level of 2135. However, it looks like the price of Ethereum should rise for a while. So, let’s observe what might happen next.
The price of Brent oil is repeatedly testing the resistance level of 84.00. It might either rebound from this level or break it through and target the level of 95.00 at the beginning of the next trading week. At this point, it would be important to follow the candlestick formations to forecast the upcoming price movements.
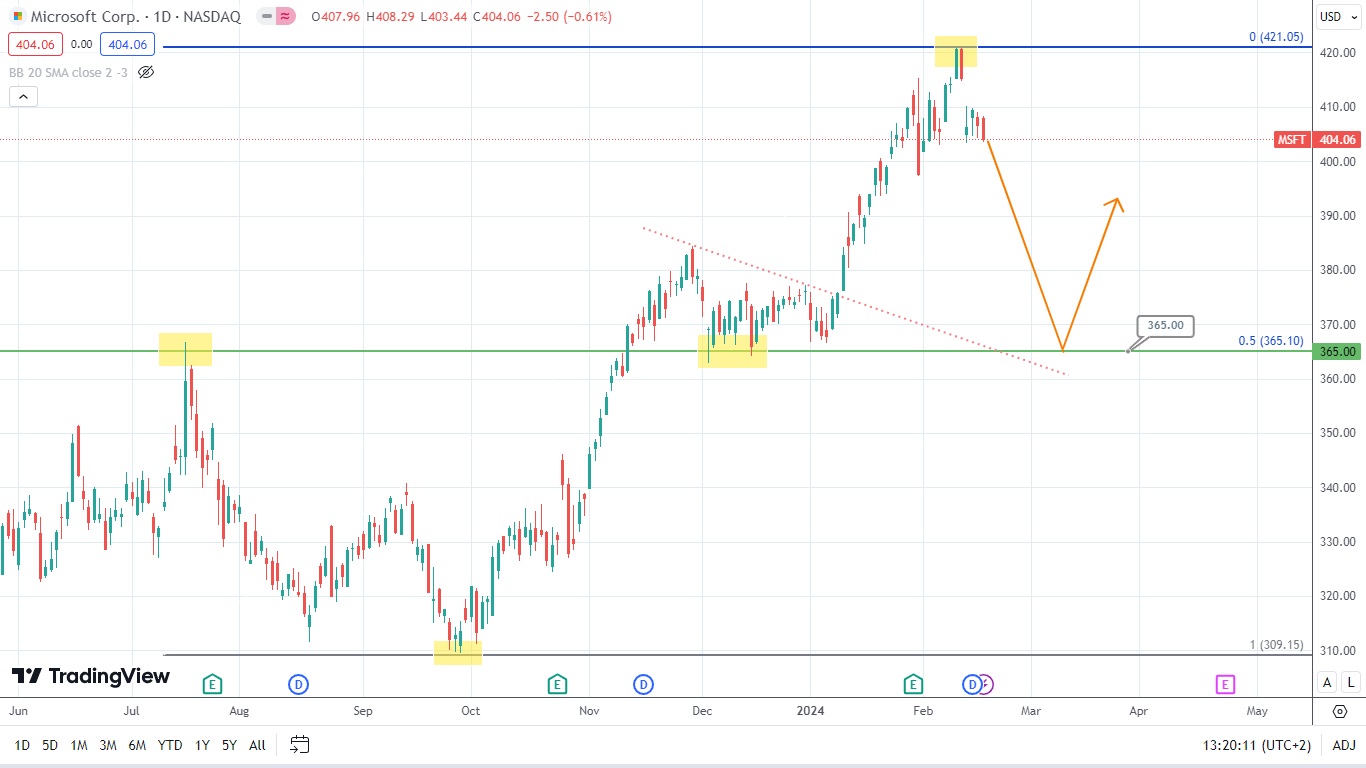
The price of Microsoft stocks renewed the maximum points and underwent correction. It might gain the required support at the level of 365, which also acts as a 50% Fibonacci retracement level from the latest ascending move. The asset’s price has tested this level several times in a row. Hence, this scenario is most likely to work out.
Disclaimer: The material provided is for information purposes only and should not be considered as investment advice. The views, information, or opinions expressed in the text belong solely to the author, and not to the author’s employer, organization, committee or other group or individual or company.
Past performance is not indicative of future results.
High Risk Warning: CFDs are complex instruments and come with a high risk of losing money rapidly due to leverage. 69% and 73% of retail investor accounts lose money when trading CFDs with Tickmill UK Ltd and Tickmill Europe Ltd respectively. You should consider whether you understand how CFDs work and whether you can afford to take the high risk of losing your money.
Futures and Options: Trading futures and options on margin carries a high degree of risk and may result in losses exceeding your initial investment. These products are not suitable for all investors. Ensure you fully understand the risks and take appropriate care to manage your risk.