The IndeX Files 31-12-2019
Equities End The year At Highs
Global benchmark equities end the year well into highs with asset markets around the globe celebrating the beginning of the end for the US-Sino trade war, the evasion of a hard-Brexit in the UK and the still-low money market rates across the G10.
The US and China have now confirmed that the phase-one trade deal laid out in October will now be signed by the two leaders, allowing for negotiations to progress onto the next step. The next round of talks, aimed at delivering a “phase-two” deal, will be more encompassing in terms of the content of the deal. Given the division which remains over priority issues, such as the handing of intellectual property and access to the Chinese market, there is some reservation among investors which could drive weakness over the start of 2020.
In the UK, investor attention will soon turn to the trade talks between the EU and the UK following the UK’s departure date from the EU on January 31st. The current deadline for a trade deal is December 31st 2020, giving 11 months for negotiations. The key to the path of UK assets over this period will be whether talks look on course to deliver a deal and whether the Prime Minister changes his mind and allows an extension if a deal is not ready in time.
In terms of central banking policy, investors remain encouraged by a concerned tone from each of the Federal Reserve, the ECB and the BOE. While easing has been put on pause for now, there are not yet any signs that rate will be adjusted higher and incoming data could see easing expectations return if further weakness materialises.
Technical View
DAX (Bullish, above 13155.27)
From a technical viewpoint. DAX has been consolidating above the monthly pivot at 13155.27. With longer-term VWAP still positive a further move higher remains the preferred view. However, bearish divergence in momentum studies highlights scope for a correction back to the yearly R1 at 12660.42, which should offer support.

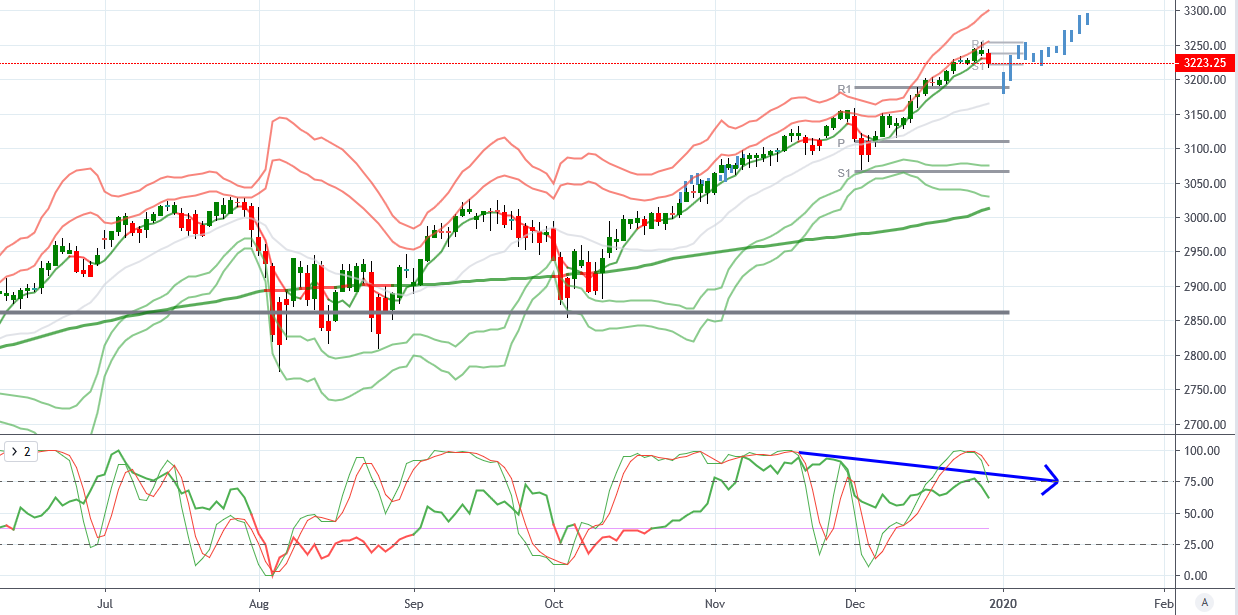
S&P500 (Bullish, above 3109.25 )
From a technical viewpoint. Price has continued higher recently and is well above the monthly pivot at 3109.25. Near-term bias is for the bull trend to continue though worth noting bearish divergence in momentum studies which could see a correction develop.
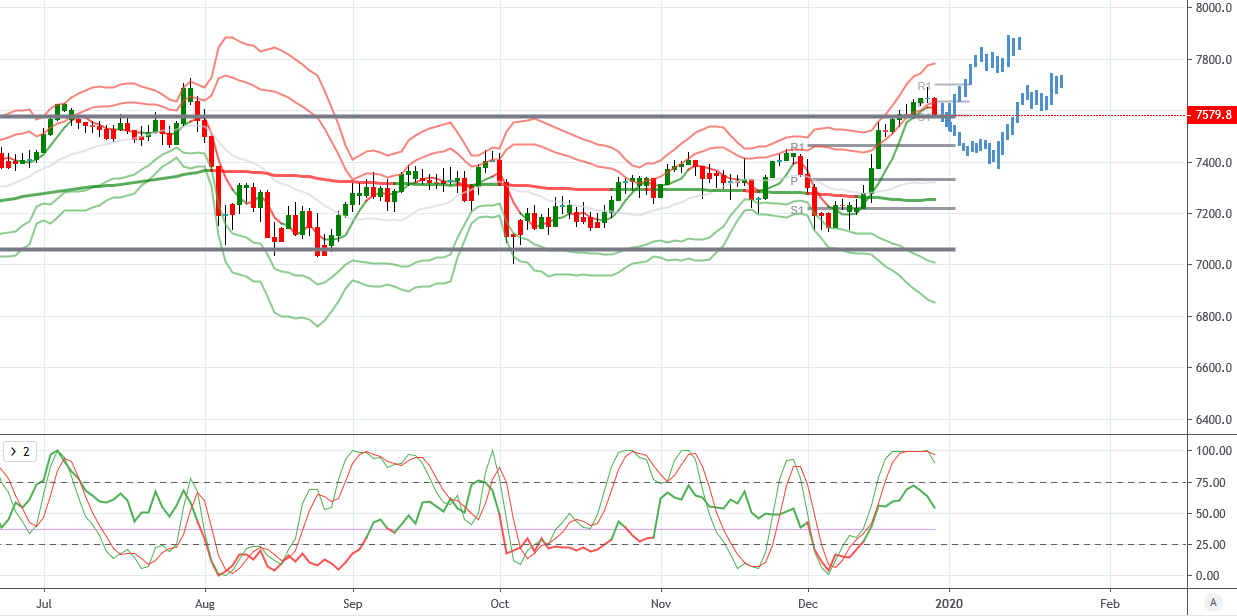
FTSE (Bullish, above 7338.6)
From a technical viewpoint. Price is now retesting the yearly R1 at 7579.3 which bulls will be looking to defend, encouraged by positive longer-term VWAP. If the correction runs deeper, however, the next support will be into the monthly pivot at 7338.6
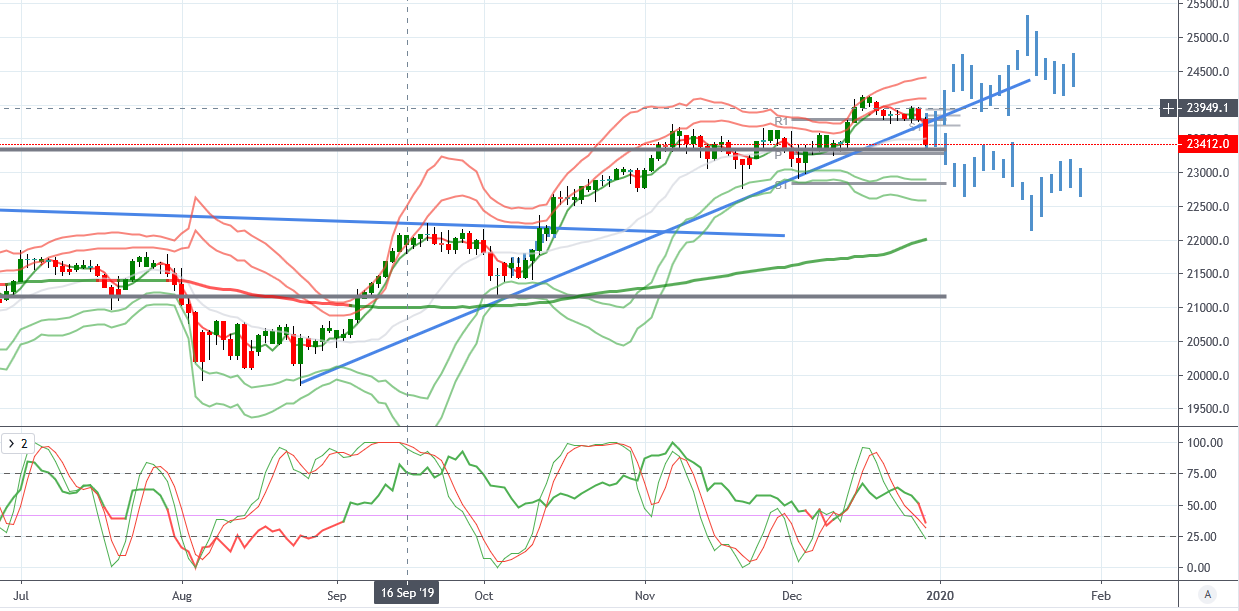
Nikkei (Bullish, above 23242.1, Bearish below )
From a technical viewpoint. Price is now retesting the monthly pivot at 23242.1. With longer-term VWAP still positive, support here should turn the Nikkei higher again. If we break below however and the pivot holds as resistance, a deeper move back to VWAP could be seen.
Disclaimer: The material provided is for information purposes only and should not be considered as investment advice. The views, information, or opinions expressed in the text belong solely to the author, and not to the author’s employer, organization, committee or other group or individual or company.
High Risk Warning: CFDs are complex instruments and come with a high risk of losing money rapidly due to leverage. 72% and 71% of retail investor accounts lose money when trading CFDs with Tickmill UK Ltd and Tickmill Europe Ltd respectively. You should consider whether you understand how CFDs work and whether you can afford to take the high risk of losing your money.
Disclaimer: The material provided is for information purposes only and should not be considered as investment advice. The views, information, or opinions expressed in the text belong solely to the author, and not to the author’s employer, organization, committee or other group or individual or company.
Past performance is not indicative of future results.
High Risk Warning: CFDs are complex instruments and come with a high risk of losing money rapidly due to leverage. 69% and 73% of retail investor accounts lose money when trading CFDs with Tickmill UK Ltd and Tickmill Europe Ltd respectively. You should consider whether you understand how CFDs work and whether you can afford to take the high risk of losing your money.
Futures and Options: Trading futures and options on margin carries a high degree of risk and may result in losses exceeding your initial investment. These products are not suitable for all investors. Ensure you fully understand the risks and take appropriate care to manage your risk.
Patrick has been involved in the financial markets for well over a decade as a self-educated professional trader and money manager. Flitting between the roles of market commentator, analyst and mentor, Patrick has improved the technical skills and psychological stance of literally hundreds of traders – coaching them to become savvy market operators!