S&P500 Daily Action Areas & Price Targets 2/11/26

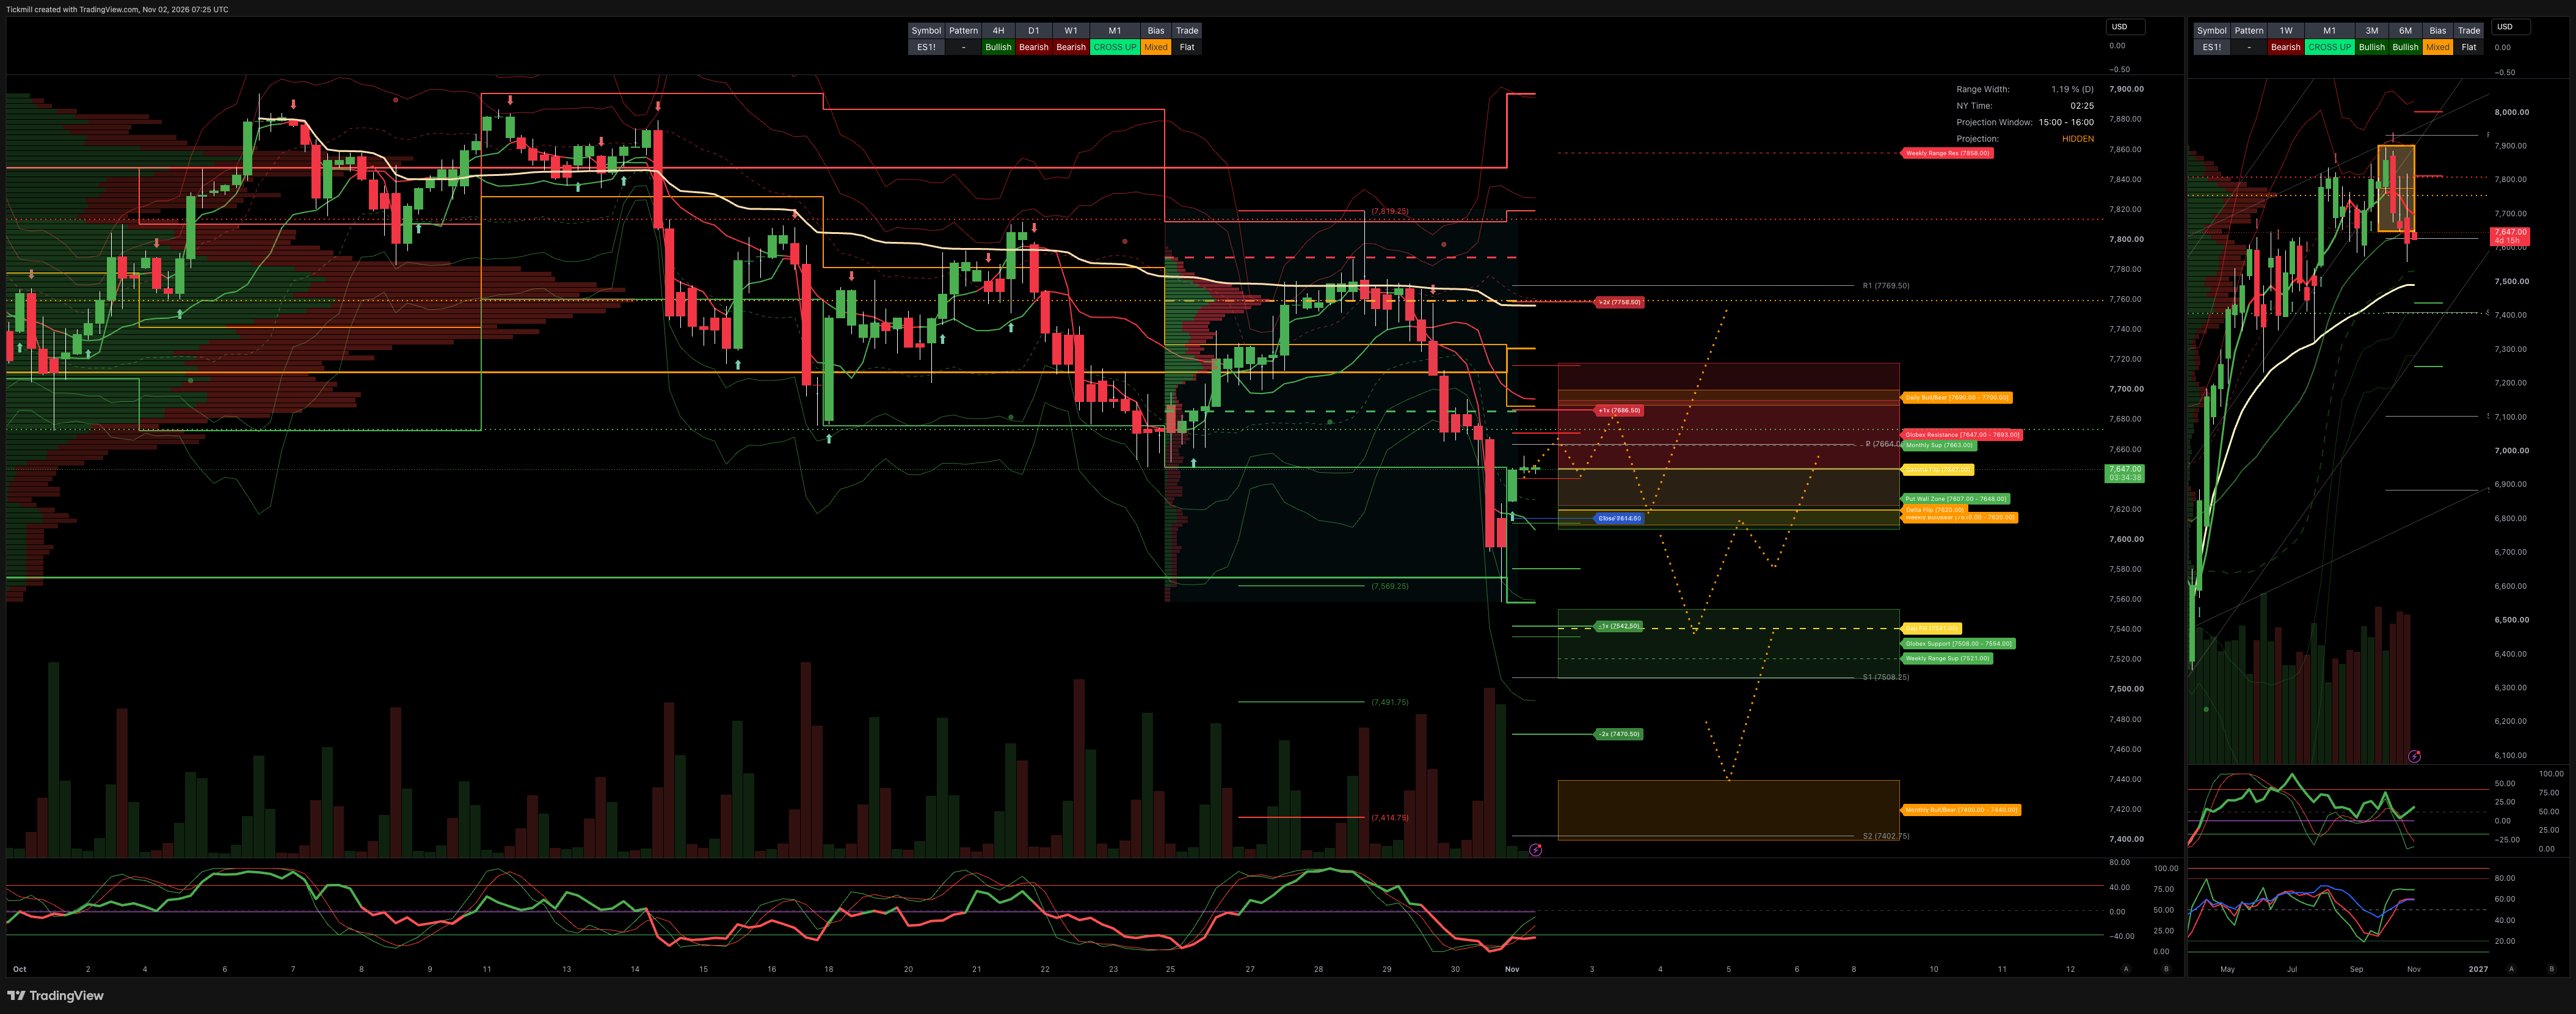
S&P500 Daily Action Areas & Price Targets 2/11/26
***QUOTING ES1!(Z CONTRACT LEVLES) FOR CASH US500 EQUIVALENT LEVELS, SUBTRACT POINT DIFFERENCE***
MONTHLY-WEEKLY& DAILY LEVELS
MONTHLY BULL BEAR ZONE 7440/7400
MONTHLY RANGE RES 7960 SUP 7663
WEEKLY BULL BEAR ZONE 7620/10
WEEKLY RANGE RES 7858 SUP 7521
DAILY BULL BEAR ZONE 7690/7700
GLOBEX RANGE SUP 7554-7508 RES 7647/93
GAMMA FLIP 7647
DELTA FLIP 7620
CALL WALLS 7718/7623
PUT WALLS 7648/7607
GAP FILL 7541
DAILY STRUCTURE - OTFL - 7670
WEEKLY STRUCTURE - OTFL - 7794
MONTHLY STRUCTURE - BALANCE - 7897/7542
VIX BULL BEAR ZONE 18.72
VVIX-to-VIX The ratio of 5.48 compression is the main market driver, with the VVIX dropping more than the VIX, maintaining the ratio within the 5.0 to 6.0 range. This indicates a decrease in short-term tail risk insurance premiums, favoring volatility-selling strategies. Above 6.0 – 7.0+ signals higher risk and demand for options due to market volatility concerns.
PRIMARY TRADES & TARGETS
SHORT ON REJECT/RECLAIM DBBZ TARGET RTH CLOSE
***ADDITIONAL SETUPS & TARGETS HIGHLIGHTED ON THE CHARTS***
(I FADE TESTS OF 2 SIGMA LEVELS ESPECIALLY INTO THE FINAL HOUR OF THE NY CASH SESSION AS 90% OF THE TIME WHEN TESTED THE MARKET WILL CLOSE ABOVE OR BELOW THESE LEVELS)
SPX PUT/CALL RATIO 1.10 (The numbers reflect options traded during the current session.) A put-call ratio below 0.7 is generally considered bullish, and a put-call ratio above 1.0 is generally considered bearish.
JHEQX Upside cap (~7,920–7,950): Dealer gamma hedging at this call strike creates resistance, with market makers likely selling futures into strength and limiting volatility. Downside cushion (~7,270): If SPX drops 5% into Q4, long put gamma may force dealers to buy futures as the index falls, helping stabilize prices. Expiration: December 31, 2026. Strong pinning effects are likely near key strikes into year-end expiration.
DEC2025 OPEX to DEC2026 OPEX is 945 points giving us a range of [5889,7779]
Notes On Structure Implications
Balance: This refers to a market condition where prices move within a defined range, reflecting uncertainty as participants await further market-generated information. Our approach to balance includes favouring fade trades at the range extremes (highs/lows) while preparing for potential breakout scenarios if the balance shifts.
One-Time Framing Higher (OTFH): This represents a market trend where each successive bar forms a higher low, signalling a strong and consistent upward movement.
One-Time Framing Lower (OTFL): This describes a market trend where each successive bar forms a lower high, indicating a pronounced and steady downward movement.
GOLDMAN SACHS FICC & EQUITY TRADING DESK VIEWS
THE TAKE: SYSTEMATIC SUPPLY HIJACKS TECH WHILE CONSUMER OUTPERFORMS
A week that initially showed constructive institutional accumulation in Semiconductors reversed aggressively into the weekend, concluding with a heavy, unbuffered drawdown across tech benchmarks. Trading floor execution confirmed that Asset Managers finished as definitive net sellers, completely unwinding early-week tech buying and pressing further supply. In contrast, Hedge Fund flows finished balanced, driven predominantly by short covering in Macro Products and single stocks rather than genuine risk appetite.
The velocity of the decline was notably orderly compared to the violent gap-downs of prior weeks, pointing to top-down systematic liquidation and month-end portfolio rebalancing rather than single-stock panics. Major index ETF turnover surged to ~31% of total exchange volume, marking the highest full-session share since June.
Defensive rotation emerged clearly into the close: Consumer outperformed the tape on Thursday and Friday, powered by a classic flight-to-safety from tech into Consumer Staples, alongside robust earnings prints across Restaurants (Chipotle CMG, Wingstop WING, Brinker EAT) and Cruise Lines (Norwegian NCLH, Royal Caribbean RCL), combined with short covering in beat-down discretionary names (Crocs CROX, Boot Barn BOOT).
PRIME BROKERAGE WEEKLY & MID-DAY MTM PERFORMANCE
Leverage Dynamics (as of COB Oct 29):
US Fundamental L/S Gross Leverage: Ticked up +0.1 pts to 216.3% (66th percentile 1-year).
US Fundamental L/S Net Leverage: Rebounded +3.6 pts to 47.0% (7th percentile 1-year).
Flow Character: While HFs broke a 3-week selling streak to net buy US equities for the first time in 4 weeks, the buying was almost entirely short covers in Macro Products (ETFs) and select single stocks.
Tech Supply Persistence: Although Information Technology registered as the most net-bought sector through Thursday via short-covering, it remains severely net sold on an October MTD basis. Mega-cap tech names were net sold in 4 of the last 5 trading sessions, indicating zero structural recovery in risk tolerance.
Mid-Day Performance Mark-to-Market:
Global Fundamental L/S: Lost -1.2% (-1.8 SD move) on the day, dragged by beta and tech; down -3.6% MTD (holding +9.0% YTD).
Asia-Focused Funds: Down -1.2% (-1.0 SD move); down -9.5% MTD (holding +14.0% YTD).
TMT-Focused Funds: Plunged -3.8% (-2.6 SD move); down -12.6% MTD, drastically cutting YTD gains to +5.1%.
CRITICAL S&P 500 SYSTEMATIC & CTA TRIGGER LEVELS
With systematic supply dominating index execution, the desk is strictly tracking two primary downside pivot levels where institutional volume and CTA model triggers reside:
100-Day Moving Average: 7,614 (Key technical trend support).
CTA Medium-Term Systematic Pivot: 7,554 (The primary structural threshold where the vast majority of open systematic notional is concentrated). A sustained break below 7,554 risks flipping medium-term trend followers into accelerated programmatic selling.
NEXT WEEK'S HIGH-IMPACT CATALYST GAUNTLET
The derivatives surface prices an S&P 500 implied move of 1.84% through Friday, November 6, reflecting an unusually dense cluster of macro, political, and corporate earnings catalysts:
Day / Date | Event / Data Release | Market Transmission Vector & Focus Items |
Monday (Nov 2) | Apple ( | Anchors the final major megacap wave; primary test for tech stabilization. |
Tuesday (Nov 3) | US Midterm Elections | Prediction markets (Kalshi) price a 65% probability of a Democratic sweep; key for fiscal policy and contractor risk. |
Wednesday (Nov 4) | Treasury Quarterly Refunding (QRA) | Detailed auction sizes and tenor allocations; heavy focus on 20-Year and 30-Year long-end issuance size. |
Friday (Nov 6) | US Employment Situation (NFP) | Labor market resilience vs. wage inflation check ahead of December FOMC. |
Disclaimer: The material provided is for information purposes only and should not be considered as investment advice. The views, information, or opinions expressed in the text belong solely to the author, and not to the author’s employer, organization, committee or other group or individual or company.
Past performance is not indicative of future results.
High Risk Warning: CFDs are complex instruments and come with a high risk of losing money rapidly due to leverage. 68% and 74% of retail investor accounts lose money when trading CFDs with Tickmill UK Ltd and Tickmill Europe Ltd respectively. You should consider whether you understand how CFDs work and whether you can afford to take the high risk of losing your money.
Futures and Options: Trading futures and options on margin carries a high degree of risk and may result in losses exceeding your initial investment. These products are not suitable for all investors. Ensure you fully understand the risks and take appropriate care to manage your risk.
Patrick has been involved in the financial markets for well over a decade as a self-educated professional trader and money manager. Flitting between the roles of market commentator, analyst and mentor, Patrick has improved the technical skills and psychological stance of literally hundreds of traders – coaching them to become savvy market operators!