S&P500 Daily Action Areas & Price Targets 22/9/26

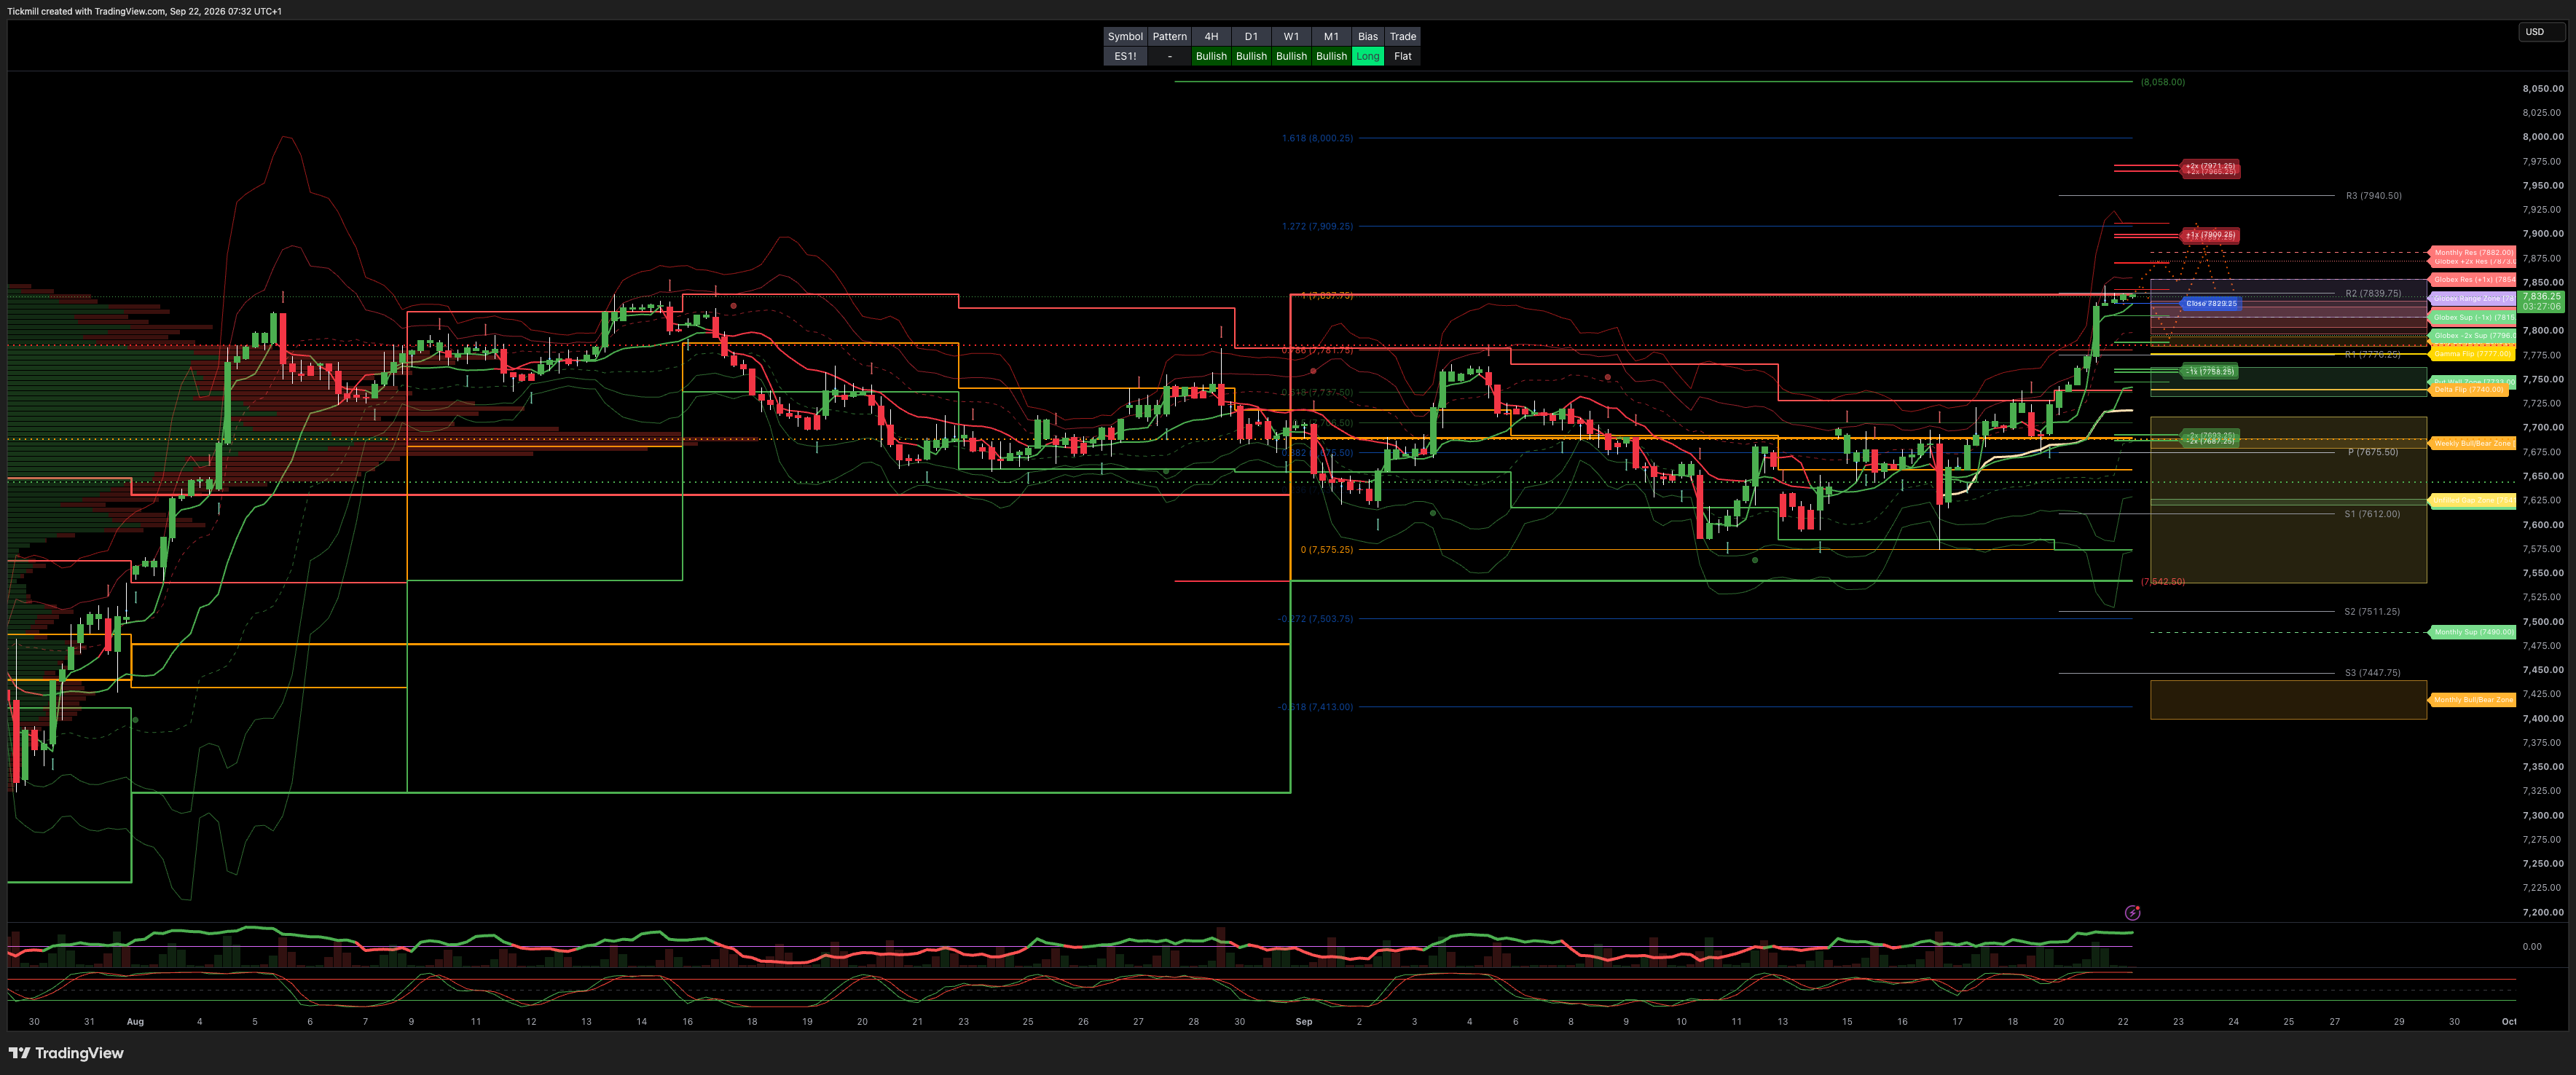
S&P500 Daily Action Areas & Price Targets 22/9/26
***QUOTING ES1!(Z CONTRACT LEVLES) FOR CASH US500 EQUIVALENT LEVELS, SUBTRACT POINT DIFFERENCE***
MONTHLY-WEEKLY& DAILY LEVELS
MONTHLY BULL BEAR ZONE 7440/7400
MONTHLY RANGE RES 7882 SUP 7490
WEEKLY BULL BEAR ZONE 7690/80
WEEKLY RANGE RES 7826/7798 SUP 7621/27
DAILY BULL BEAR ZONE 7785/95
GLOBEX RANGE SUP 7815 RES 7854
2 SIGMA RANGE SUP 7796 RES 7873
GAMMA FLIP 7777
DELTA FLIP 7740
CALL WALLS 7832/7805
PUT WALLS 7733 - 7763
UNFILLED GAPS 7541 - 7712
DAILY STRUCTURE - OTFH - 7758
WEEKLY STRUCTURE - OTFL - 7717
MONTHLY STRUCTURE - OTFH - 7542
VIX BULL BEAR ZONE 17.7
VVIX / VIX 5.0–6.0:Tension Building (Current: 5.77) — VIX stays low (~14.8), smart money likely paying for tail-risk hedges on volatility.
PRIMARY TRADES & TARGETS
LONG ON REJECT/RECLAIM DBBZ TARGET DAILY RANGE RES
***ADDITIONAL SETUPS & TARGETS HIGHLIGHTED ON THE CHARTS***
(I FADE TESTS OF 2 SIGMA LEVELS ESPECIALLY INTO THE FINAL HOUR OF THE NY CASH SESSION AS 90% OF THE TIME WHEN TESTED THE MARKET WILL CLOSE ABOVE OR BELOW THESE LEVELS)
SPX PUT/CALL RATIO 0.81 (The numbers reflect options traded during the current session.) A put-call ratio below 0.7 is generally considered bullish, and a put-call ratio above 1.0 is generally considered bearish.
JHEQX Q3 Collar Short Call Cap: ~7,750 – 7,900 - Long Put Strike: ~7,050 – 7,100 (approx. 5% downside protection) Short Put Strike: ~5,950
DEC2025 OPEX to DEC2026 OPEX is 945 points giving us a range of [5889,7779]
Notes On Structure Implications
Balance: This refers to a market condition where prices move within a defined range, reflecting uncertainty as participants await further market-generated information. Our approach to balance includes favouring fade trades at the range extremes (highs/lows) while preparing for potential breakout scenarios if the balance shifts.
One-Time Framing Higher (OTFH): This represents a market trend where each successive bar forms a higher low, signalling a strong and consistent upward movement.
One-Time Framing Lower (OTFL): This describes a market trend where each successive bar forms a lower high, indicating a pronounced and steady downward movement.
GOLDMAN SACHS FICC & EQUITY TRADING DESK VIEWS
THE TAKE: GEOPOLITICAL OPTIMISM & META MUSE RALLY DRIVE BENCHMARKS HIGHER
US equities kicked off the week with a powerful rally—the S&P 500 recorded its best single-day performance since August 4 (+149 bps to 7,764), while the tech-heavy Nasdaq-100 surged +283 bps to 30,482. The advance was fueled by geopolitical tailwinds ahead of the UN General Assembly, including constructive bilateral talks leading into the upcoming Trump-Xi summit on Thursday (President Xi’s first US visit since 2023).
Energy prices eased sharply (WTI Crude -4.83% to $95.46/bbl) after President Trump expressed openness to diplomatic resolution regarding Houthi conflicts. Furthermore, Middle East supply logistics continue to recover, with Crude and LNG shipments through the Strait of Hormuz reaching a 6-month high. Treasury yields moderated slightly (US 10-Year -4.7 bps to 4.949%).
MARKET SUMMARY & ASSET BREAKDOWN
S&P 500 (SPX): Closed at 7,764.00 (+1.49%) | Best session since Aug 4 | MOC $2.3B to SELL | Remaining weekly straddle priced at 90 bps
Nasdaq-100 (NDX): Closed at 30,482.00 (+2.83%) | Led by mega-cap Tech and CPU/Inference plays
Russell 2000 (RUT): Closed at 2,881.00 (+0.74%) | Small-caps joined rally as yields eased below 4.95%
Dow Jones (DJI): Closed at 52,050.00 (+0.71%) | Lagged tech-heavy benchmarks
US 10-Year Treasury: Yield at 4.949% (-4.7 bps) | Eased off recent 5.0%+ cycle highs
WTI Crude: Price at $95.46 (-4.83%) | Dropped below $96 as Hormuz traffic hit 6-month highs and diplomacy signals emerged
Gold: Price at $4,342.00 (-0.82%) | Mild pull-back as broad risk-on sentiment took hold
Bitcoin: Price at $86,659.00 (+6.89%) | Strong crypto rally reflecting broad risk-on liquidity surge
CBOE VIX: Closed at 14.87 (+6 bps) | Spot-up/vol-up correlation; short-dated upside calls actively chased
SINGLE STOCK & FACTOR SPOTLIGHT
Meta Platforms (META): Surged +11.43% (best single-day gain in 17 months; +17% over past 9 sessions), accounting for ~15% of the total S&P 500 advance. The move was driven by surging Meta Muse adoption, which hit #1 on the US App Store with ~73,000 daily downloads.
CPU & Inference Infrastructure Rally: Accelerating AI inference demand triggered massive synchronized gains across CPU designers and suppliers:
ARM Holdings (ARM): +17.16%
Intel (INTC): +12.17%
AMD (AMD): +9.95%
INSTITUTIONAL FLOWS & DERIVATIVES COLOR
Desk Activity (-22 bps to SALE / 3/10 Rating):
Asset Managers (LOs): Net buyers of +$779M (demand in Tech, Communication Services, and macro products vs. supply in Staples and Discretionary).
Hedge Funds: Net sellers of -$974M (supply in macro products and Energy vs. demand in Comm Services, Tech, and Financials).
Derivatives & Volatility Dynamics:
S&P Implied Move: Morning 30 bps implied move overrealized by 5x during the intraday push. Short-dated upside calls were actively chased as institutional clients remain under-positioned for upside moves.
IWM Gamma Value: With 2-year implied volatility at multi-year lows, IWM 3-month gamma is sub-5th percentile (5-year lookback), presenting an attractive entry for cheap small-cap convexity.
Dealer Gamma Shift: Dealers moved deeper into a long gamma pocket across +/- 3% bands, stabilizing the market against extreme downside breaks.
INTC Options Flow: GS clients were buyers of 1-month INTC Call Spreads to capture upside as CPU capacity tightens relative to inference demand.
Disclaimer: The material provided is for information purposes only and should not be considered as investment advice. The views, information, or opinions expressed in the text belong solely to the author, and not to the author’s employer, organization, committee or other group or individual or company.
Past performance is not indicative of future results.
High Risk Warning: CFDs are complex instruments and come with a high risk of losing money rapidly due to leverage. 69% and 73% of retail investor accounts lose money when trading CFDs with Tickmill UK Ltd and Tickmill Europe Ltd respectively. You should consider whether you understand how CFDs work and whether you can afford to take the high risk of losing your money.
Futures and Options: Trading futures and options on margin carries a high degree of risk and may result in losses exceeding your initial investment. These products are not suitable for all investors. Ensure you fully understand the risks and take appropriate care to manage your risk.
Patrick has been involved in the financial markets for well over a decade as a self-educated professional trader and money manager. Flitting between the roles of market commentator, analyst and mentor, Patrick has improved the technical skills and psychological stance of literally hundreds of traders – coaching them to become savvy market operators!