S&P500 Daily Action Areas & Price Targets 5/11/26

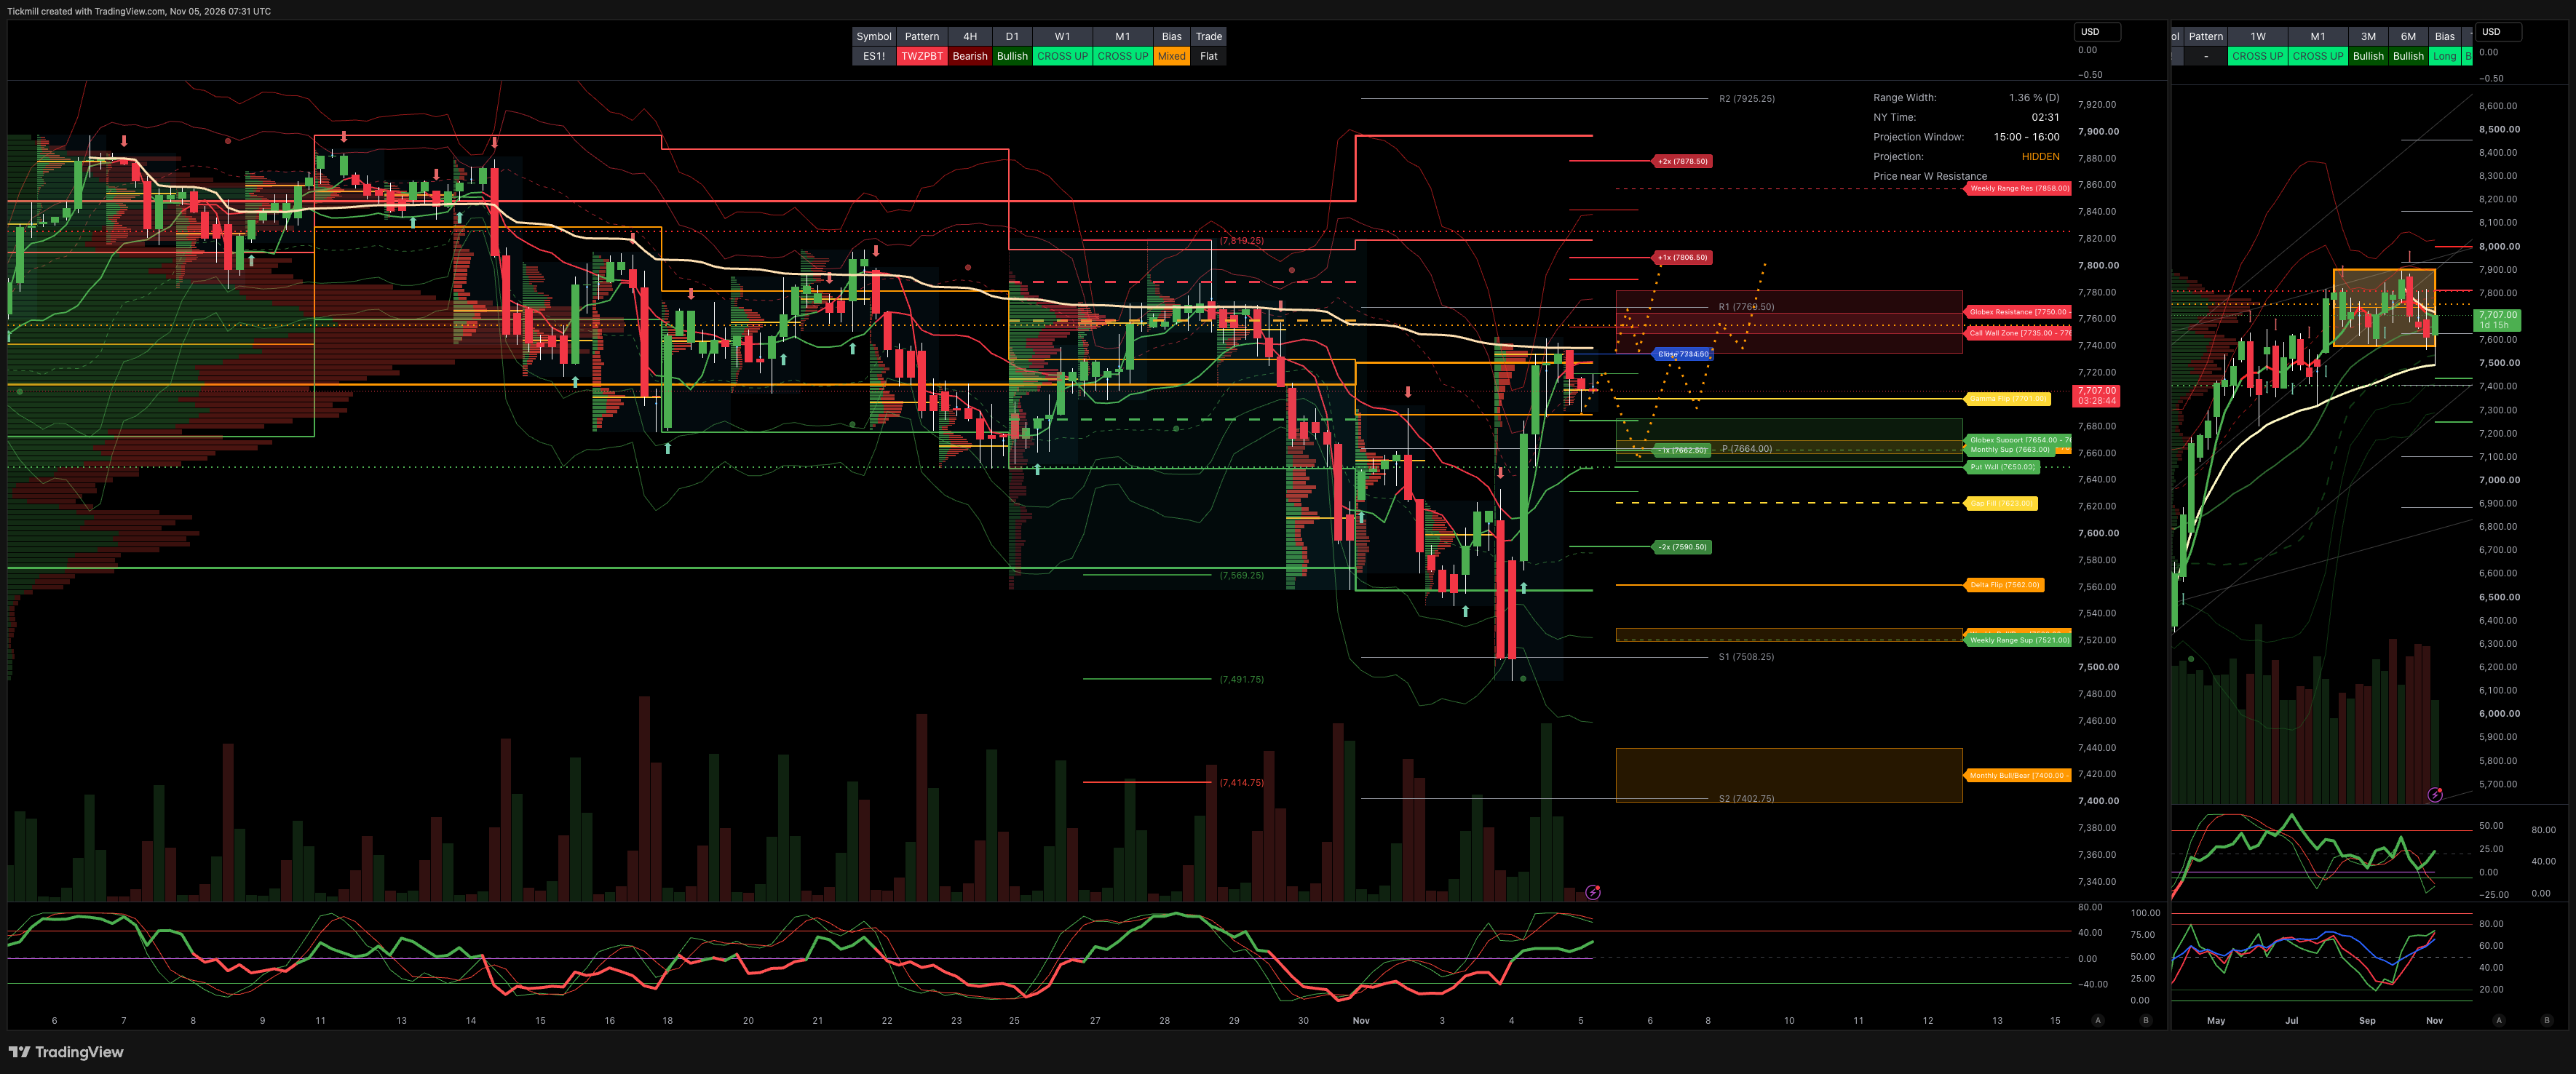
S&P500 Daily Action Areas & Price Targets 5/11/26
***QUOTING ES1!(Z CONTRACT LEVLES) FOR CASH US500 EQUIVALENT LEVELS, SUBTRACT POINT DIFFERENCE***
MONTHLY-WEEKLY& DAILY LEVELS
MONTHLY BULL BEAR ZONE 7440/7400
MONTHLY RANGE RES 7960 SUP 7663
WEEKLY BULL BEAR ZONE 7530/20
WEEKLY RANGE RES 7858 SUP 7521
DAILY BULL BEAR ZONE 7660/70
GLOBEX RANGE SUP 7686/54 RES 7750/82
GAMMA FLIP 7701
DELTA FLIP 7562
CALL WALLS 7735/65
PUT WALLS 7650
GAP FILL 7623
DAILY STRUCTURE - OTFH - 7679
WEEKLY STRUCTURE - OTFL - 7794
MONTHLY STRUCTURE - BALANCE - 7897/7542
VIX BULL BEAR ZONE 18.72
VVIX-to-VIX The ratio of 5.44 compression is the main market driver, with the VVIX dropping more than the VIX, maintaining the ratio within the 5.0 to 6.0 range. This indicates a decrease in short-term tail risk insurance premiums, favoring volatility-selling strategies. Above 6.0 – 7.0+ signals higher risk and demand for options due to market volatility concerns.
PRIMARY TRADES & TARGETS
LONG ON REJECT/RECLAIM WBBZ TARGET RTH CLOSE
***ADDITIONAL SETUPS & TARGETS HIGHLIGHTED ON THE CHARTS***
(I FADE TESTS OF 2 SIGMA LEVELS ESPECIALLY INTO THE FINAL HOUR OF THE NY CASH SESSION AS 90% OF THE TIME WHEN TESTED THE MARKET WILL CLOSE ABOVE OR BELOW THESE LEVELS)
SPX PUT/CALL RATIO 1.13 (The numbers reflect options traded during the current session.) A put-call ratio below 0.7 is generally considered bullish, and a put-call ratio above 1.0 is generally considered bearish.
JHEQX Upside cap (~7,920–7,950): Dealer gamma hedging at this call strike creates resistance, with market makers likely selling futures into strength and limiting volatility. Downside cushion (~7,270): If SPX drops 5% into Q4, long put gamma may force dealers to buy futures as the index falls, helping stabilize prices. Expiration: December 31, 2026. Strong pinning effects are likely near key strikes into year-end expiration.
DEC2025 OPEX to DEC2026 OPEX is 945 points giving us a range of [5889,7779]
Notes On Structure Implications
Balance: This refers to a market condition where prices move within a defined range, reflecting uncertainty as participants await further market-generated information. Our approach to balance includes favouring fade trades at the range extremes (highs/lows) while preparing for potential breakout scenarios if the balance shifts.
One-Time Framing Higher (OTFH): This represents a market trend where each successive bar forms a higher low, signalling a strong and consistent upward movement.
One-Time Framing Lower (OTFL): This describes a market trend where each successive bar forms a lower high, indicating a pronounced and steady downward movement.
GOLDMAN SACHS FICC & EQUITY TRADING DESK VIEWS
THE TAKE: POST-MIDTERM CLEARING EVENT UNLEASHES MASSIVE VOL CRUSH & POWERFUL CONSUMER SQUEEZE
US equities staged an explosive post-midterm reversal rally across all major benchmarks (S&P 500 +1.58% to 7,688; Dow Jones +3.03% to 53,356; Russell 2000 +1.51% to 2,854; Nasdaq-100 +0.91% to 28,437). President Donald Trump’s public acceptance of the midterm results removed a major left-tail geopolitical and constitutional risk overhang, triggering an immediate cross-asset relief bid.
The removal of the political risk premium sparked a steep collapse in commodity and rate pressures: WTI Crude plunged -7.82% to $88.57/bbl (Brent broke down through the key $95/bbl level), and the US 10-Year yield declined -7 bps to 4.88%.
Lower input costs, historically depressed positioning, and expectations of protected domestic social spending (e.g., SNAP programs in upcoming fiscal negotiations) funneled aggressive capital directly into Consumer:
The Retail basket (
XRT) surged +5.5% on the day—outperforming the S&P 500 by +390 bps, marking the 2nd largest 1-day alpha outperformance in the last 2 years and liftingXRTto 5-year highs.Consumer Staples (
XLP) broke out to new all-time highs.
MARKET SUMMARY & ASSET BREAKDOWN
S&P 500 (SPX): Closed at 7,688.00 (+1.58%) | MOC $2.0B to SELL | VIX collapsed -19.54% to 16.76 | Remaining weekly straddle: 91 bps
Nasdaq-100 (NDX): Closed at 28,437.00 (+0.91%) | Lagged broad market due to persistent semiconductor supply
Russell 2000 (RUT): Closed at 2,854.00 (+1.51%) | Small-cap cyclicals bid up on duration relief (10Y @ 4.88%)
Dow Jones (DJI): Closed at 53,356.00 (+3.03%) | Major outperformance driven by heavyweights in Retail, Industrials, and Staples
US 10-Year Treasury: Yield down -7 bps to 4.88% | Decisive break below 4.90%
WTI Crude: Price down -7.82% to $88.57/bbl | Crushed below $90/bbl on post-election geopolitical de-escalation pricing
Gold: Price up +3.43% to $4,064.00/oz | Rebounded alongside USD weakening
Bitcoin: Price up +3.07% to $80,198.00 | Reclaimed the $80,000 threshold on risk-on appetite
US Dollar Index (DXY): Down -35 bps to 101.51 | Eased on the retreat in front-end yields
DESK FLOWS, BIFURCATION & LONG-ONLY CASH HOARDS
Execution Floor Activity (6/10 Rating):
Exchange volume was explosive, running 30%+ above the 20-day average at 21.73B shares.
Floor execution finished +2% better to buy, with Asset Managers and Hedge Funds finishing roughly balanced in aggregate.
Under-the-Hood Sector Bifurcation (Compute Owners vs. Builders):
The new political and regulatory landscape created clear divergence: Net buying in Hyperscalers vs. heavy supply in Semiconductors.
Desk Read: The election outcome is viewed as constructive for compute owners (hyperscalers) with fortress balance sheets, but headwind-heavy for those who build, power, or lever up data centers (neoclouds, semicap equipment, power/utility suppliers).
The Long-Only Cash Dynamic (John Flood Perspective):
Institutional accounts have endured difficult performance since July, with hedge fund net exposure sitting at historic lows.
Active Mutual Funds and Long-Only managers were forced to liquidate heavily ahead of the October 31 fiscal year-end tax-loss deadline (especially on Friday, October 30).
Consequently, the LO community is sitting on massive unallocated cash piles raised during the July and October sell-offs. With midterms serving as a clean clearing event, this un-deployed cash represents significant dry powder, though Flood cautions that the ultimate clearing event for 2026 remains tied to equity capital markets (ECM) supply absorption.
POST-BELL EARNINGS DIGESTION
Qualcomm (
QCOM-4% AH): Reported solid top-line revenue guidance, but mixed EPS and EBIT performance led to post-market softness.Zillow Group (
ZG-22% AH): Dropped after posting clear misses across both revenue and Adjusted EBITDA.AppLovin (
APP+15% AH): Surged on an earnings beat accompanied by forward revenue and EBITDA guidance well above consensus bogeys.
DERIVATIVES & VOLATILITY: HISTORIC VOL REVERSION & DEALER GAMMA
Event Volatility Implosion: With election uncertainty out of the tape, implied volatility was crushed across the board. S&P December fixed-strike volatility declined by 1.2 vols, bringing short-dated OTM calls back under 11 vol.
Tail Hedge Monetization: Downside protection was dumped aggressively at the open. Over 530k VIX call options traded (predominantly sold) within the first hour alone.
Vol of Vol (VVIX) Flush: The VVIX index collapsed by -18 points at intraday lows, settling down -17 points on the day.
Return to Long Dealer Gamma: The sharp rally pushed market makers back into positive dealer gamma territory. However, desk strategists note that because topside implied volatility is already compressed, a continuation of the rally could see implied vol begin to "float" higher in tandem with spot (a topside convexity bid).
Flow Positioning: Volume was dominated by short covering and downside hedge unwinds rather than fresh levered long deployment, though airline upside calls saw restructuring (buying Dec call upside in
UALandDAL).Desk Preference: The derivatives desk favors owning SPX options over NDX, as S&P implied volatility continues to screen as materially cheaper.
GIR MACRO TAKE: POST-MIDTERM FISCAL DYNAMICS
Goldman Sachs Global Investment Research emphasizes that the larger-than-expected Democratic House majority will:
Provide Democratic leadership slightly greater leverage in fiscal negotiations with the White House.
Dilute the influence of fringe congressional factions, enabling more pragmatic legislative horse-trading.
Leverage upcoming fiscal statutory deadlines (such as the December 11 government funding deadline) to push for diplomatic limits on Middle East escalation, negotiate rollbacks on select tariffs (~2-point drag), and attempt to reverse prior spending cuts.
Disclaimer: The material provided is for information purposes only and should not be considered as investment advice. The views, information, or opinions expressed in the text belong solely to the author, and not to the author’s employer, organization, committee or other group or individual or company.
Past performance is not indicative of future results.
High Risk Warning: CFDs are complex instruments and come with a high risk of losing money rapidly due to leverage. 68% and 74% of retail investor accounts lose money when trading CFDs with Tickmill UK Ltd and Tickmill Europe Ltd respectively. You should consider whether you understand how CFDs work and whether you can afford to take the high risk of losing your money.
Futures and Options: Trading futures and options on margin carries a high degree of risk and may result in losses exceeding your initial investment. These products are not suitable for all investors. Ensure you fully understand the risks and take appropriate care to manage your risk.
Patrick has been involved in the financial markets for well over a decade as a self-educated professional trader and money manager. Flitting between the roles of market commentator, analyst and mentor, Patrick has improved the technical skills and psychological stance of literally hundreds of traders – coaching them to become savvy market operators!